On The Spinners In The First Three Tests
On its media website, the BCCI publishes detailed scorecards of cricket matches. For some series like the ongoing India v England Test series this also includes hawkeye data. I looked up this ball-by-ball data because I wanted to see what it said about how much the ball has spun and how the spinners have bowled. There is a lot which we can tell simply by eyeballing the game. But the danger with eyeballing is we tend to look for what we expect to see. The ball-tracking data offers a counterpoint to this tendency.
Two important notes. First, the record for the first Test is limited to the last 4 days of the Test. The record for Day 1 is unavailable. Second, for the purposes of this discussion, I consider only finger spinners. I’ve set aside Kuldeep Yadav.
A note about the record: The BCCI website does not publish all the details of the hawkeye data. They publish the pitching line and length (basically, the pitching point), and beehive (which is the point relative to the stumps at which the ball crosses the plane of the stumps.) The base of the middle stump is the origin. For the line of the ball, a negative figure (in metres) represents the off-side for the right hander. For example, a line of -0.3, is 30 cm. to the off-side of the middle-stump for the right hander. A ball pitching on right-hander’s leg stump would have a line figure of about +0.11, while a ball pitching on the right-hander’s off stump would have a line figure of about -0.11.
I use the average deviation from the vertical (the line from middle stump to middle stump down the length of the pitch) to estimate turn. This average uses the absolute value of the deviation. So if one ball is bowled by a left arm spinner and the deviation is -10cm (since it spins to towards the off side for the right hander), and one ball is bowled by an off spinner and the deviation is 20cm (since it spins towards the leg side for the right hander), then the average deviation is 15 cm [(20+10)/2], and not 5 cm [(20+(-10))/2].
It will take more space than one post commands for an exhaustive discussion of what the ball tracking data tells us. Here i’ll make three observations.
1. The amount of turn in each Test
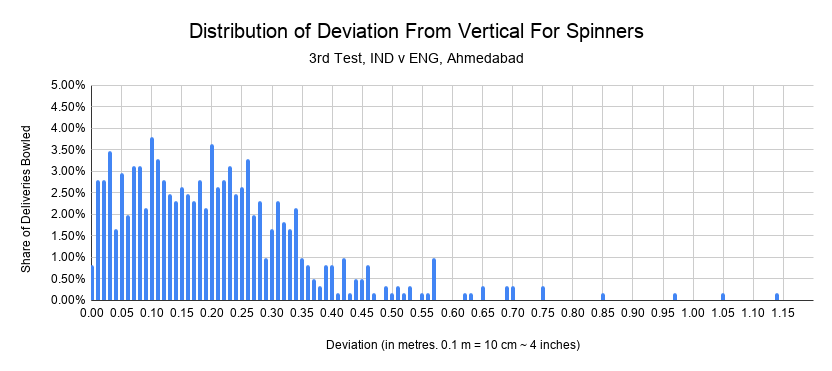
The average deviation from the vertical was 24.3 cm (1st Test), 23.6 cm (2nd Test), and 20.5 cm (3rd Test). The top line numbers suggest that the shortest, lowest scoring Test involved less turn when compared to the 1st and 2nd Tests. For a better view, I looked up the deviation for the four different matchups - based on the bowling arm against left handers and right handers. These are given in the table below, followed by the distribution of deliveries by deviation.
The breakdown backs the top line numbers. There’s something to be said for bowlers choosing to bowl over or round the wicket, but this is roughly equally likely in every Test match. Overall, 32% of deliveries deviated more than a foot (30 cm) in 1st Test, 29% of deliveries did it in the 2nd Test, and 20% of deliveries did it in the 3rd Test.
The ball turned more at Chennai than it did at Motera. And yet, Motera produced fewer runs by some distance. The two Chennai Tests produced 1285 and 913 runs. The Motera Test produced 387 runs.
2. On the bounce available
The bounce has generally been consistent. Shooters have not been observed. The general variation evident in the plot below is explained by the differing amounts of overspin, pace, trajectory, flight and point of release (contrast, for instance, Patel’s high release with Nadeem or Bess or Moeen’s lower release). Some of the variation is also due to the age of the ball and the nature of the ball. The pink ball is built differently from the red one.
That one ball which flew to a height of 2.82 metres was bowled by Jack Leach in the 12th over of the 4th innings of the 1st Test at Chennai. It was a penultimate over of the 4th days play. Four other deliveries crossed the stumps at a height of more than 1.5 metres (5 ft). These were bowled by R Ashwin and Axar Patel in the 2nd and 4th innings of the 2nd Test at Chennai.

3. How have the individual spinners bowled in this series?
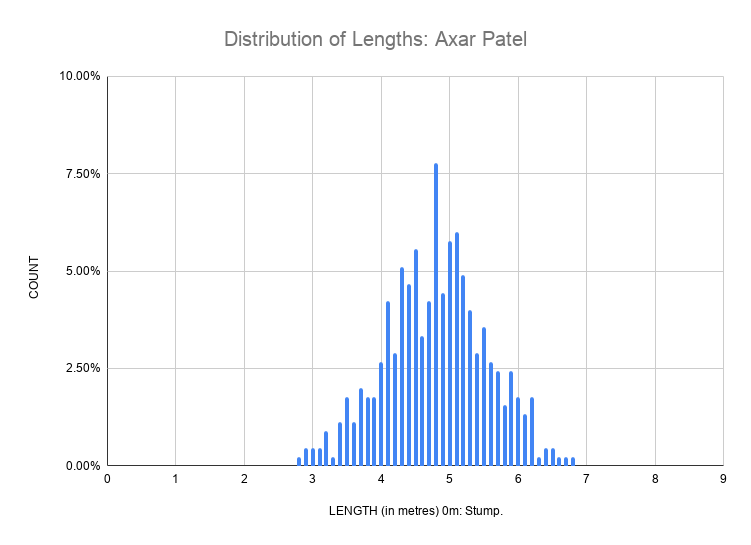
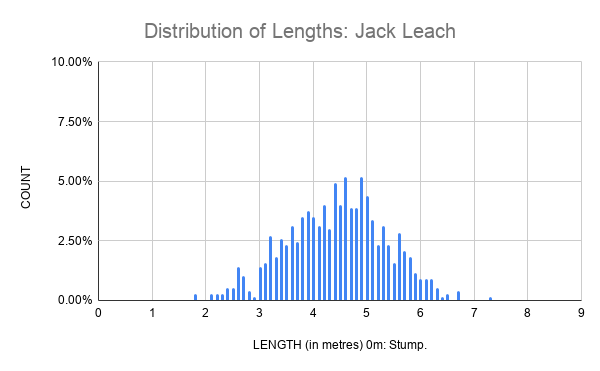
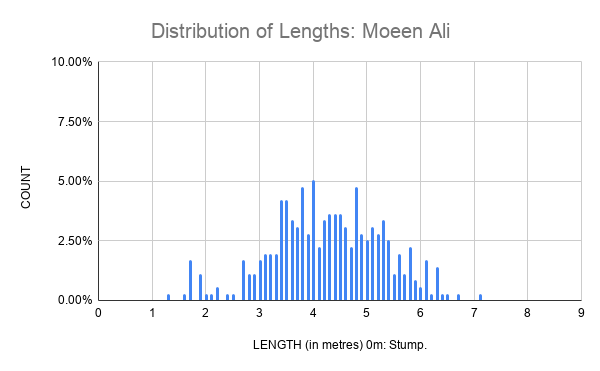
Here, I’m going to limit myself to a focus on length. As Erapalli Prasanna’s famous maxim goes “Line is optional, length is mandatory”. The batting crease in the charts below lies at 1.2m (4 ft). If we consider that a bowler is over-pitching if the ball lands within six feet of the batting crease, then its worth looking at how often each bowler over-pitched.
R Ashwin: 27/694, 3.9% over-pitched.
Axar Patel: 3/450, 0.7%
Jack Leach: 39/773, 5.1%
Moeen Ali: 32/357, 9.0%
Joe Root: 10/151, 6.6%
Dom Bess: 37/198, 18.7%
Shahbaz Nadeem: 6/228, 2.6%
Washington Sundar: 8/88, 9.1%
If we say that a length shorter than 6 metres is short-pitched, then
R Ashwin: 29/694, 4.2% short.
Axar Patel: 22/450, 4.9%
Jack Leach: 25/773, 3.2%
Moeen Ali: 16/357, 4.5%
Joe Root: 17/151, 11.6%
Dom Bess: 11/198, 5.6%
Shahbaz Nadeem: 9/228, 3.9%
Washington Sundar: 2/88, 2.3%
In the first three Tests of this series, England’s spinners have over-pitched 8% of their deliveries - once every 2 overs. India’s spinners have over-pitched 3% of their deliveries - once every 5 overs. The shorter length has to be viewed with more caution, because often it is not simply a case of the bowler dragging it down. Spinners also shorten their length because they see the batsman stepping down the pitch.
The upshot of all this is that the available ball-tracking record shows that England’s spinners have bowled the ball either too short or too full 187 times in 1479 balls (1 ball in 8), while India’s spinner have bowled the ball either too short or too full 106 times in 1460 balls (1 ball in 14).
The consequence of all this is evident in the rate of scoring. Ashwin has conceded 2.6 runs per over, Axar Patel 2.2 runs per over, and Nadeem 3.9. By comparison, Leach has gone for 3.2 runs per over, Moeen 3.7, Bess 3.7, and Root 3.2.
India have had the better, deeper attack for these conditions, and consequently, they’ve been able to exert control from both ends in a way which England have failed to do, especially in the 2nd and 3rd Test.
There’s a lot more to be said about the ball-tracking data. I’ll post more on this at the end of the series.


Where is the data available? I can only find the ball by ball visualisation on the website and not the data points.
Amazing analysis! If only such nuanced analysis could be discussed alongside the live feed, rather than that utter BS "psychobabble"