


Runs Above Average Replacement (RAAR)
In T20

The expected runs from a delivery in a T20 innings depends on four measurements:
The number of balls remaining in the innings (b)
The number of wickets in hand (w)
The scoring rate at the start of the delivery (e)
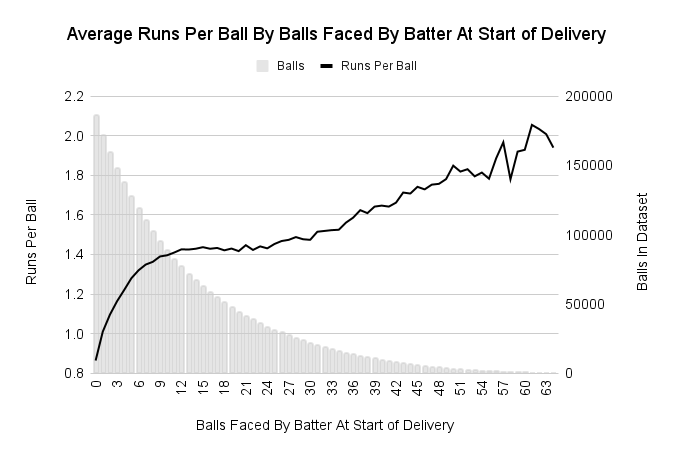
The number of balls faced by the batter. (bf)
The balls remaining in the innings and the wickets in hand are the two finite resource in limited overs cricket. The scoring rate at the start of the delivery represents the scoring conditions. The number of balls faced by the batter in the innings at the start of a delivery represent how long the batter has spent in the prevalent scoring conditions. The effect of each of these four factors on the runs per ball in T20 is shown in the four figures below.


To estimate the expected runs (xR) and expected wickets (xW) from a delivery, the combined influence of these four factors has to be measured. Each delivery is represented by (bf, b, w, e). For example, the first ball of the innings would be (0, 120, 10, 0). A batter about to face his eleventh delivery with the score at 2/60 after 8 overs would be (10, 72, 8, 1.25). The standard way to do this is by regression. In the implementation I use for my xR and xW estimates, I used a DNN regression.
Runs Above Average Replacement for each delivery are given by the actual runs scored by the batter (or conceded by the bowler, not the same thing, extras other than leg byes and byes also count against the bowler, while only runs off the bat count for the batter) minus the xR estimated by the model.
Runs Above Average Replacement (raar) for all innings of 70 or more in the 2025 IPL so far are given below. Quicker scoring in lower scoring innings accrues a a larger raar. For example, KL Rahul’s 77(37) in a score of 169/4 in 107 balls has a raar of +26.0 runs, while Shreyas Iyer’s 82(36) in a score of 245/6 in 120 balls has a raar of +23.9. The model expected 58.1 runs to be scored from the 36 balls Iyer faced. It expected 51 runs from the 37 balls KL Rahul faced. Similarly, Krunal Pandya’s 73(47) on April 27th had a raar of +12.4 runs. Yashasvi Jaiswal’s 70(40) in significantly quicker scoring conditions had a raar of +4.8 runs.

A few sample xR and xW values are also given below.

Thanks for explaining your RaaR methodology. I had a few questions:
1. Did you consider additional features as well for your RaaR model? For example, does the innings number (first innings or second) have an impact on expected runs, holding all else constant?
2. Also, intuitively it feels like the runs remaining (target - current runs) could have an impact on expected runs, for second innings specifically. So, did you consider building a separate model for chases specifically, with runs remaining as an additional feature?
3. How do you typically score this model, when calculating RaaR for a batter's innings? Do you do it ball-by-ball? For example, for each ball a batter plays, you use features up to the previous ball and then predict expected runs off that ball? And then sum it up across all balls played by the batter?
4. I am curious what that cyclic pattern in the 2nd chart represents? Is it like the first ball of every over?
Do you have data of shot types as well? Is it possible to answer questions like how often should a batter try to hit the ball for boundary to maximize the raar. I remember your analysis from tests that included shot choice.