


A Preview Of The World Test Championship Final
My model says New Zealand are favored, but that both sides are strong

The World Test Championship final is a strange, one-off Test match. India will face New Zealand in Southampton, England from June 18-22. As things stand the weather prediction for the first day is unfavorable. This post is really about trying to describe the match-up between the two teams. For this, I’ll briefly introduce a Monte Carlo simulation I developed a few years ago.
These are the results of the simulation of all available first class matches so far. The monte carlo simulation returns an expected win percentage for each side. The chart on the left gives the expected win percentage against the actual win percentage for all teams with that expected win percentage. The chart on the left gives the distribution of teams in matches by the expected win percentage (1% ~ 1200 XIs, since there are 60,527 matches and consequently 121,154 teams for which expectations have been calculated).
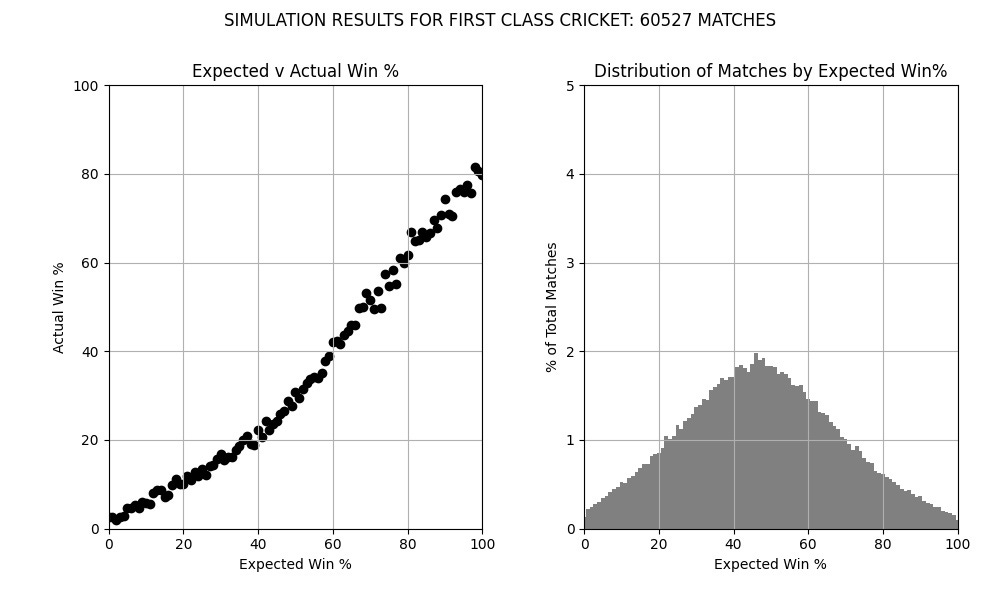
Past performance enables a fairly robust description of future expectation. This model considers the actual playing XIs, the venue, the host country and information about which team bat’s first.
A monte carlo simulation of a Test match can be constructed as follows:
1. For each player participating in a Test match, a record of performance in each previous Test cap is given by (date, ground, host, first_bat, runs, dismissals, balls bowled, runs conceded, wickets taken). For ODIs, balls faced can also be included but since balls faced is not available for all Test matches at the level of the individual player’s innings, this is not used in the model.
2. To play a Test match, randomly select one record from each player’s previous matches1. This way, you have 11 randomly selected records for each team. Calculate the runs per wicket scored and conceded for each team. Set up a team score for each team to be the average of the runs per wicket scored by the team, and conceded by the opposing team. Whichever team has the higher score is the stronger team. You can also summarize the number of balls required to get the result, and, for example, if it is more than 450 six ball overs, you can assign the result as a draw. This is the approach used in the simulation of first class matches above.
3. Play the Test match 100,000 times and calculate the number of wins for each team, and the number of draws. You can also collect other estimate, such as the distribution of expected runs per wicket scored and conceded for each team, and the expected team scores. This provides addition information from the simulation.
This simulation can be improved by biasing the list of previous match records for each player. If you want to give more weight to matches against the current opponent, or matches at the current venue, or in the current host country, you can repeat those records in the list of previous match records. In the simulation of first class matches described above, the records are biased by (1) venue, (2) host country, (3) batting first or second, (4) opponent, (5) batting first or second in the host country, (6) batting first or second at the venue, (7) batting first or second in the host country against the current opposition, and (8) batting first or second at the venue against the current opposition.
This approach is crude, but it is also forgiving. Where previous evidence of matches are not available (i.e. India have never faced New Zealand in a Test match in England before, so 7 and 8 will add nothing to the list for the WTC final), the simulation uses whatever previous record is available. Other biases can be imagined by readers and used in their versions of the simulation.
What does this simulation predict for the World Test Championship Final?
First, the XIs I’ve used for the simulation are as follows:
India: Gill, Rohit Sharma, Pujara, Kohli, Rahane, Pant, Ashwin, Jadeja, Shami, Ishant, Bumrah.
New Zealand: Latham, Conway, Williamson, Taylor, Nicholls, Watling, Jamieson, Patel, Boult, Southee, Wagner
If India bat first, the for a Test match at Southampton, India are stronger in 37% of simulations, while New Zealand are stronger in 63% of simulations. Only 7.8% of simulations, involve more than 450 overs being used to produce a result. This suggests that the two sides are unlikely to play out a draw.
The details under the hood show that India’s expected score (the average of score by India and conceded by NZ) is 308, which NZ’s expected score is 343. India’s expected batting score is 348 runs, while their expected bowling score is 278. New Zealand’s expected batting score is 407, while their expected bowling strength is 269. The two bowling attacks are evenly matched, but New Zealand’s batting is rated stronger than India’s by the model.
This is due to several reasons. First, India have lost to New Zealand in New Zealand in 2020, when most of the players who will feature in this week’s final also played. Second, New Zealand have just beaten England in England, so their record in England moves the needle upwards for them, while India, even though they were competitive in each Test, lost the last time they were in England.
The table below gives the raw and biased batting and bowling measures for the simulation of the match above. New Zealand have six batsmen averaging over 40 in the match up while India have four. However, two of New Zealand’s six are players who have had a strong start to their (as yet) very short Test careers - Jamieson and Conway.

If India bat second, then New Zealand win expectation rises to 68%, while India’s drops to 32%. This is because India have struggled in England when they have not batted first in recent years. India’s away record in general has been superior when India bat first, than Tests where they bowl first.
Broadly, New Zealand start as modest favorites in the World Test Championship Final. For the most part, this is because of their recent finds (Conway and Jamieson), and form. Indeed, the presence of India and New Zealand in this marquee Test match can be put down to the emergence of several stars during this Test cycle - Jamieson, Wagner, most recently Conway, Pant, Bumrah, and most recently for India, Gill. These new players have embellished the well established cores of India and New Zealand in a way that the new additions to England and Australia during this Test cycle (with the notable solitary exception of Jofra Archer) have not been able to do. Nevertheless, the focus should not be on the new stars this week. It will be a clash to two top class, deep bowling attacks. India will most probably leave out Mohammed Siraj, and New Zealand would leave out Matt Henry - two bowlers who would be first choice for most contemporary Test teams.
It promises to be a closely fought Test match. The strengths of the attacks make a result very likely as long as the wicket is not a rank featherbed and the weather holds long enough to permit about 350 overs of play. History suggests that India would be better off batting first if they get to make the choice. But the prospect of rain on the first day makes this a trickier choice than usual. All this makes this a good toss to lose.
New Zealand are the form side, and have played in England already this month. They’re favored in my book.
If a player is on debut, choose randomly from a list of debut records in Test cricket.