Control: Frequently Asked Questions
This is a post in which frequently asked questions about Control are answered.
Note: This is an FAQ about control. It may be updated as and when new questions emerge. If you have this stored in your email, and would like to check for an updated version please keep here.
Original Post: March 1, 2024
Updated: March 14, 2024. (4) added.
1. What is control?
Control is a measurement developed by ESPNCricinfo nearly 25 years ago which records whether or not the batter is in control of a delivery. S. Rajesh, the stats editor at ESPNCricinfo defines control as the answer to the question “Did the ball go where the batter intended it to go?” [Listen to my conversation with him here].
The default for all dismissals which are credited to the bowler in cricket is that the batter is not in control (NIC). There are very rare exceptions such as Cheteshwar Pujara getting out caught at short mid-wicket after his pull shot hit the short-leg fielder and ballooned up there in IND’s 1st innings of the 1st Test in Chennai in 2021.
Each delivery is classified as in-control or not-in-control. No further judgment is involved. The control measurement does not evaluate or estimate how likely an NIC is to result in a dismissal, not does it presume that all NICs are equally likely to result in a dismissal. What it does record, is whether the batter was in control of the delivery. Control is not an Expected Dismissals measure.
In cricket, there are individual deliveries which look obviously close to dismissal, and other deliveries which look less obviously so. There are also individual deliveries which are more spectacular (and therefore more memorable), and ones which are less spectacular. Readers should note that these features do not make these deliveries more competitively significant. All deliveries are exactly equally competitively significant in cricket since the outcome of each counts equally. No deliveries are optional.
The landscape of control is illustrated below using two examples. Ball tracking records for 38 Tests are (or have been at various points in the last 10 years or so) publicly available at various times over the past decade. Control records have been shared with me for various articles I’ve written for ESPNCricinfo from Dec 2017 to Nov 2021. These have been mapped to build this dataset of about 63,800 deliveries in Test cricket.
A. Fast Bowler bowls down the leg side to the right hander and the batter swings and misses, or inside edges onto pad.
This is considered a bad ball. Often, batters try to glance it, or swing it over the leg side, and miss. This is classed as “not in control”, just as, a play (or swing) and miss outside off-stump is classed as “not in control”. For the left hander, the same delivery falls outside off stump. The table below shows the record for right hand bats (RHB) and left hand bats (LHB) for these deliveries outside the right hander’s leg stump. Dismissal rates off these deliveries are similar - once every 60.2 balls for RHBs and once every 61.6 balls for LHBs. An RHB is dismissed once every 23.3 not-in-control (NIC) deliveries, while an LHB is dismissed once every 13.5 NICs. Right handers play false shots every 2.8 balls to balls outside their leg stump, while lefties play one every 4.7 balls to balls outside their off stump. The real difference is in the cost of a dismissal. This is what makes bowling outside the RHB’s leg stump a bad ball (55.1 runs per wicket against the RHB, 27.6 runs per wicket against the LHB). This is almost entirely because the field restrictions prohibit more than 2 fielders behind square on the leg side, but impose no such limit on the off side. Consequently, RHBs chance their arm more often, score quicker, play false shots more often to balls outside their leg stump, but are dismissed at about the same rate as LHBs are outside their off stump.
B. Whether or not the fast bowler’s delivery is hitting the stumps
When the ball is hitting the stumps, in most cases, LBW and Bowled come into play if the batter misses the ball. However the stumps offer a relatively small target to the bowler in terms of line and length. Fast bowlers are five times more likely to get a dismissal from an NIC when the ball is on the stumps, than they are when the ball is not on the stumps. A fast bowler’s delivery which is on the stumps is four times more likely to produce a dismissal than a ball which is not on the stumps. About 13% of a fast bowler’s deliveries in the dataset are hitting the stumps.
The consequences of an NIC vary depending on whether the ball is hitting the stumps or not. They also vary depending on whether or not the bowler is bowling to the set field. By separating the action (whether the batter is in control of the delivery) from the outcome (whether the delivery results in runs or a dismissal), the control measurement helps to isolate such effects as demonstrated above.
2. What is the relationship between control and the batting conditions, and control and batting skill?
In addition to ball by ball control records which ESPNCricinfo sometimes shares upon request, they also publish the control percentage of each individual Test innings (and ODI, T20I and T20 innings). Using this, it is possible to estimate the number of NICs in each team innings. This in turn frequeny of NICs in a team innings. For instance, 80 NICs in 80 overs means a NIC frequency of 1 NIC every 6 balls, while 80 NICs in 60 overs implies one every 4.5 balls and so on.
The frequency of false shots represents jeopardy. In general, as the frequency of NICs reduces, the cost of a wicket increases. For instance, in team innings where the batting side has one NIC every 4 balls (or 75% control) the average wicket costs 21.2 runs. Where the batting side has one NIC every 6 balls (83% control), the average wicket costs 31.8 runs.
Using batting position as a proxy for skill, we see that the false shot frequency is increases for lower order batters compared to top order batters.
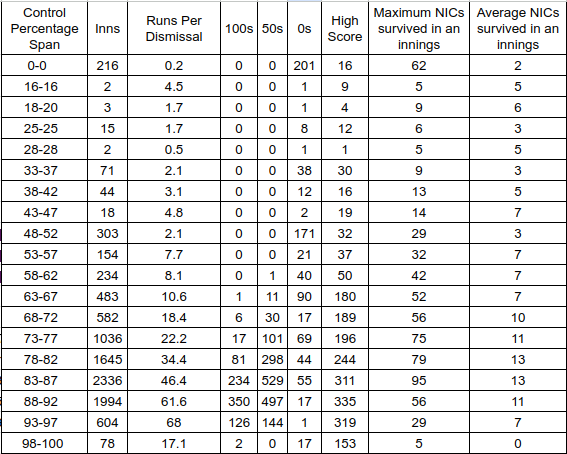
If we consider individual batting innings in Tests for positions 1-5 since the start of 2011, then their summary by the control percentage in the innings is shown in the table below. As the control percentage increases, the average runs per dismissal also increases, as does the average false shots survived per dismissal.

If we consider the same record in terms of NIC frequency (Balls Faced Per NIC), then is it as follows.
3. Isn’t the question of whether the batter is in control a matter of opinion? How do we know that the control record is reliable?
Control is a judgment exercised by the scorer in much the same way that scorers in Tennis judge Unforced Errors, and scorers in Baseball judge Fielding Errors. Much of the time, the fear of subjectivity (basically, the fear of a whimsical scorer) arises when the control record shows something which one does not expect, or more often, which one would prefer it didn’t show. As the record in (2) above shows, the recording of control is relatively straightforward. There are, to be sure, occasional marginal deliveries. But those are far from common.
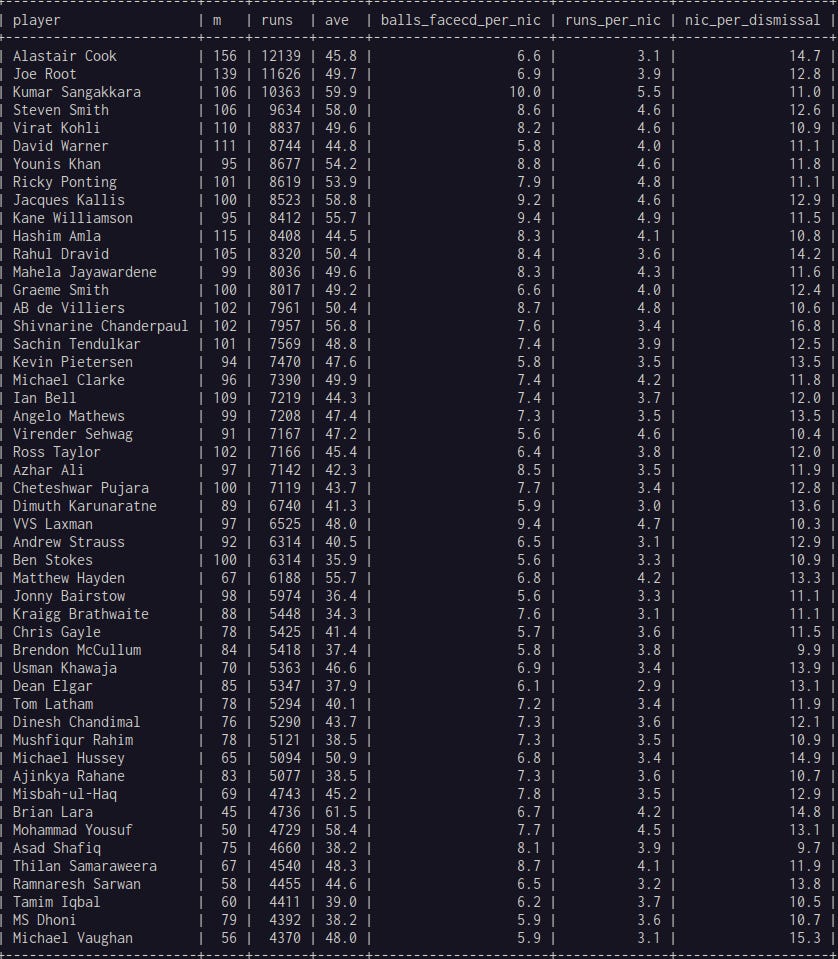
The most prolific batters for whom control records are available survive between 10 and 15 false shots per dismissal. Typically, the players who survived more than 14 NICs per dismissal (Alastair Cook, Shivnarine Chanderpaul, Michael Hussey, Rahul Dravid) tend to be either lefties or stonewallers or both. The runs per false shot measure shows the trade off that they make.
Kumar Sangakkara’s NIC record, much like his batting average, is inflated by his extraordinary returns against Bangladesh and Zimbabwe.
4. How do NIC measures predict Test match results?
Test Cricket 2011-2024: 541 Tests
Outright results: 447 - 82.6%
Fewer NICs overall win: 281 - 63%
More NICs overall win: 163 - 37%
More runs per NIC win: 87%
Fewer runs per NIC win: 58 - 13%
More balls faced per NIC win: 332 - 74%
Fewer balls faced per NIC win: 112 - 25%
More NICs per dismissal win: 368 - 82%
Fewer NICs per dismissal: 78 - 17%
The predictors of Test results from best to worst among false shot figures:
Runs Per NIC
NIC per Dismissal
Balls Faced per NIC
Total NICs


An excellent piece, kudos!
For #4, it would be interesting to a a plot of probability of winning as a function of difference between the teams' NIC frequency (and perhaps the other variables such as runs per NIC).